A profile of our membership and our funding status
Who we are…
Our active members, by age
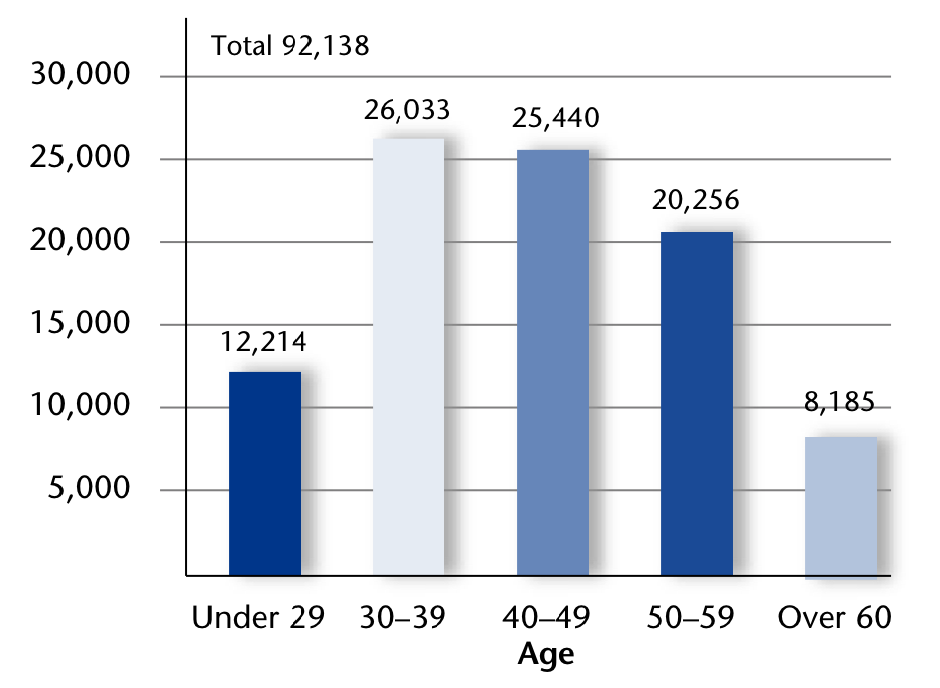
In 2004, the ratio of active members to retirees was 5:2, meaning there were five active members for every two retirees. The ratio has now decreased to less than 3:2, or three active members for every two retirees.
Our retirees and survivors, by age
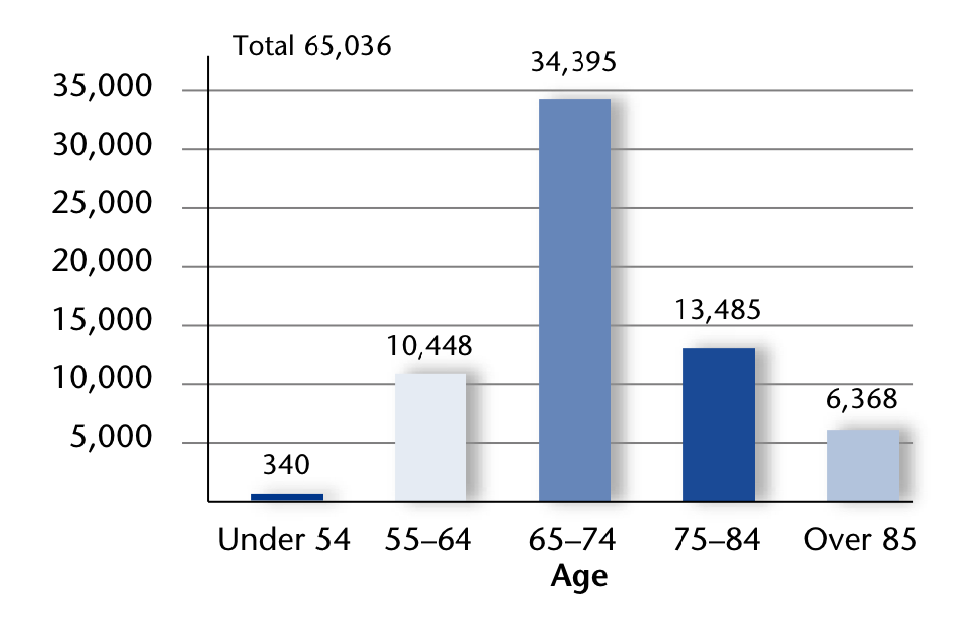
This population has never been greater, with the number of older retirees continuing to grow—including 2,581 now age 90 or over.
Average annual benefit, by recipient age
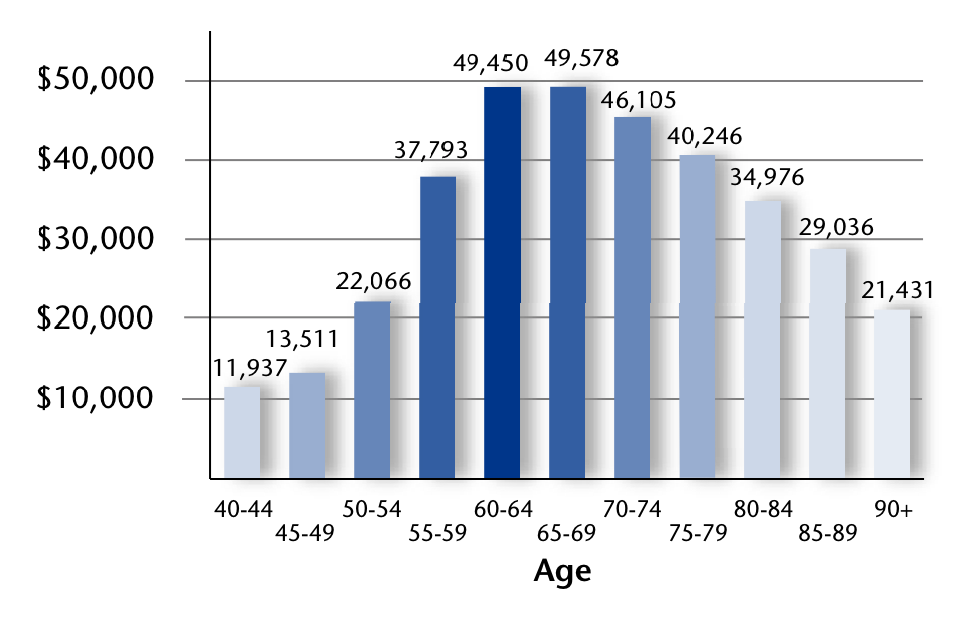
While the average benefit by age will vary from year to year based on the ages of new retirees, it has increased over the years.
Source: Public Employee Retirement Administration Commission’s 2017 Actuarial Valuation of the Massachusetts Teachers’ Retirement System .
Where we stand…
PRIM Board’s Private Equity Portfolio ranked #1 among US public pension funds by American Investment Council
In the American Investment Council’s report ranking the Top 10 private equity portfolios among 163 public funds based on 10-year annualized returns as of June 30, 2017, our PRIM Board’s Private Equity Portfolio took first place. PRIM is the only fund to rank in the Top 5 of all private equity portfolios in every year that the AIC has performed the study, including top honors in 2015 and 2013.
The PRIT fund currently invests about $7.5 billion, or 10.4% of its total, in private equity. For the period ended March 31, 2018, the portfolio’s one-year return was 25%; for three years, 19.1%, and for five years, 19.6%.
Kudos to PRIM on its continued investment performance, and congratulations on receiving this industry recognition!
PRIT core fund performance
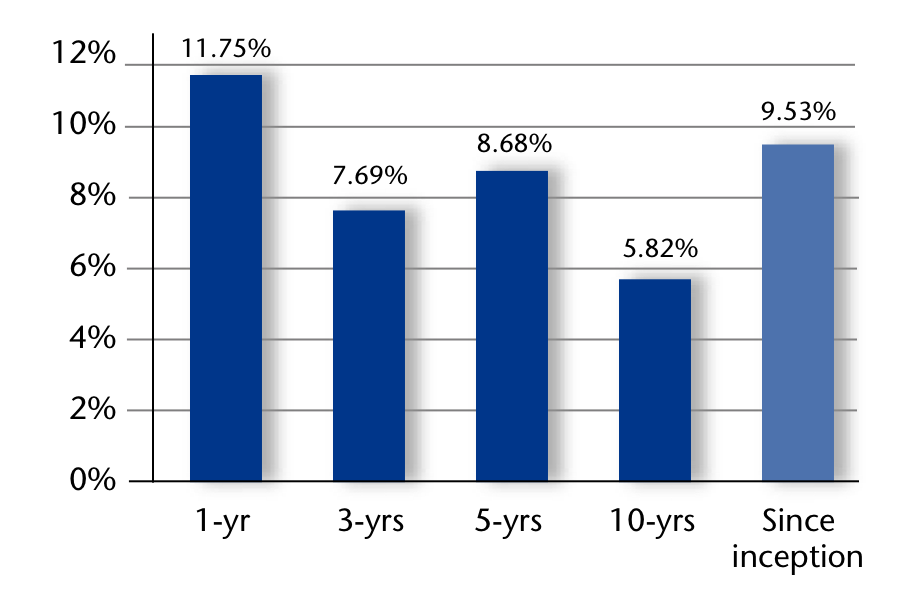
As of April 30, 2018
For 2018, the State Actuary set 7.35% as the pension fund’s long-term rate of return target. The system has averaged 5.82% over the past 10 years, and 9.53% since its inception in January 1985.
MTRS asset value
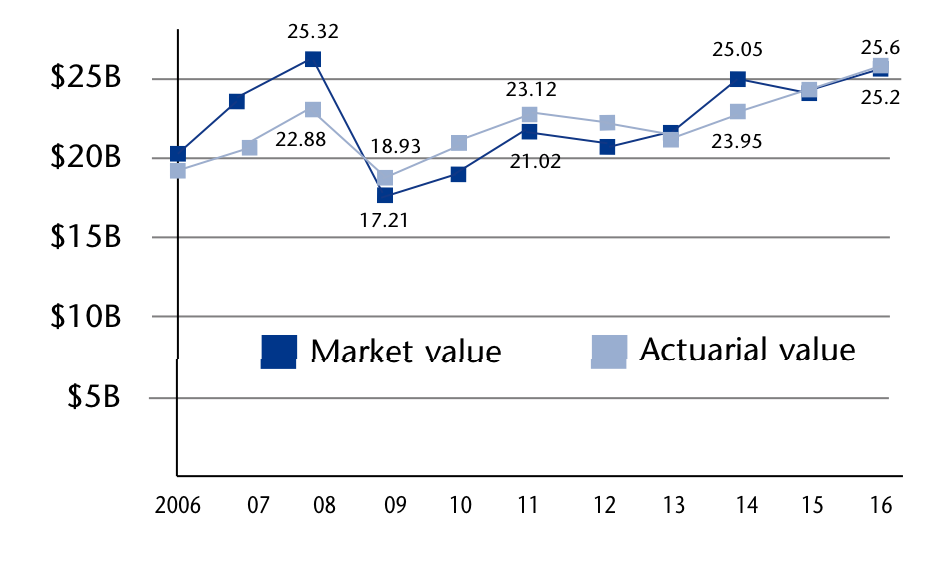
The actuarial value of assets is determined via “smoothing” of the market value over a period of five years.
Active members
- Average salary: $71,464
- Average age: 43.6 years
- Average service: 13.0 years
- Total member compensation: $6.6 b
- Employee contributions: $665 m
Retirees and survivors
- Average annual benefit: $43,642
- Average age: 72.4 years
- Total benefits paid: $2.838 b
As of January 1, 2017
- Percent funded: 52.1%
- Unfunded actuarial liability: $23.5 b
- Year fully funded: 2036
Our next valuation, effective 1/1/2018, is expected to be complete by the fall of 2018
The Teachers’ Retirement System’s assets are invested by the Pension Reserves Investment Management (PRIM) Board. As of April 30, 2018, the PRIT Fund’s assets were invested as follows:
- Global equity: 42.9%
- Core fixed income: 12.7%
- Value-added fixed income: 8.1%
- Private equity: 10.4%
- Real estate: 8.6%
- Timberland: 3.3%
- Portfolio completion strategies: 12.6%
Hedge funds, risk premia, real assets and equity hedge strategies - Cash overlay: 1.0%